Best Practices for Educational Map Animations
Nine classroom-tested rules for map animations that teach instead of distract: one idea per clip, pacing matched to the lesson, and labels a student can read from the back row.
Preview & Editor advantage
Draft with AI prompts or templates, then refine every animation step in real time (zoom, opacity, border width, colors, bearing, tilt). Credits are used only when you render the final video.
Animaps Team
Education Specialist
Best Practices for Educational Map Animations
Last updated: August 10, 2026
TL;DR
Effective educational map animations follow three principles: reduce cognitive load, match pacing to learning objectives, and make geography concrete. Teachers using AI-powered tools like Animaps can create classroom-ready map animations in under 2 minutes — no design skills required. This guide covers practical best practices for geography, history, social studies, and more.
What a classroom clip can hold in 2026 (Animaps free plan): up to 30 seconds of animation, up to 150 steps, 12 export credits a month, MP4 or GIF, 1080p, and the 3D globe view. That budget shapes every recommendation below — a lesson clip has room for roughly one idea, not five.
Related reading:
- Map animation maker hub: Create animated maps online
- Comparison hub: Map animation maker alternatives
- Classroom workflow guide: Education map workflows
- Plan limits and credits: Help center
Educational map animations have revolutionized how we teach geography, history, and social studies. When done right, they transform abstract concepts — political boundaries, migration patterns, territorial expansion — into visual stories that students remember long after the lesson ends.
When done wrong, they become distracting eye candy that adds confusion instead of clarity.
This guide covers the best practices that separate effective educational map animations from ineffective ones, with practical tips for teachers at every level.
Why Map Animations Work in Education
The Spatial Learning Problem
Geography is inherently spatial. Students need to understand not just where things are, but how places relate to each other — distances, borders, terrain, proximity. Traditional static maps show spatial relationships, but they cannot show change over time.
Map animations solve this by adding the dimension of time to spatial information:
- Borders shifting across centuries
- Trade routes connecting distant civilizations
- Migration patterns crossing continents
- Weather systems moving across regions
Research-Backed Benefits
Studies on multimedia learning consistently show that:
- Dual coding: Information presented both visually and verbally is retained better than either alone
- Spatial contiguity: Learning improves when related visual and textual information are presented near each other
- Temporal contiguity: Learning improves when narration and animation are presented simultaneously
- Segmenting: Breaking complex animations into learner-paced segments improves comprehension
- Signaling: Visual cues that highlight key information reduce extraneous cognitive load
Map animations naturally leverage all five of these principles when designed correctly.
Concrete vs. Abstract
When a teacher says "The Roman Empire stretched from Britain to Egypt," students hear words. When they see an animation that zooms out to show the full extent of Roman territory highlighted across Europe, North Africa, and the Middle East, they understand scale.
The shift from abstract description to concrete visualization is the single biggest advantage of map animations in education.
10 Best Practices for Educational Map Animations
1. One Concept Per Animation
The most common mistake: cramming too many concepts into a single animation.
Bad example: An animation that shows the Silk Road, highlights every country it passed through, adds labels for 20 cities, shows the goods traded, and traces alternative routes — all in 30 seconds.
Good example: An animation that traces the main Silk Road route from Xi'an to Constantinople, pausing at 3-4 key stops.
Rule of thumb: Each animation should answer one question:
- "Where did the Silk Road go?" (trace the route)
- "What cities were along the Silk Road?" (separate animation with labels)
- "What regions did it connect?" (separate animation with highlights)
Students can process one spatial concept at a time. Stack concepts across multiple short animations, not within one long one.
2. Match Pacing to Learning Objectives
Different learning objectives require different animation speeds.
For introduction/overview (fast pacing):
- Quick zooms to establish context
- 3-5 second animations
- Purpose: "Here is where we are looking today"
- Example: Zoom to South America at the start of a lesson on Brazilian geography
For exploration/understanding (moderate pacing):
- Slower camera movements with pauses
- 8-15 second animations
- Purpose: "Notice how these regions relate to each other"
- Example: Slowly trace the Andes mountain range from Colombia to Chile
For analysis/deep learning (slow pacing):
- Step-by-step reveals with stops
- 15-30 second animations with natural pauses
- Purpose: "Let's examine each element carefully"
- Example: Highlight each country that joined the EU chronologically, pausing between each one
With Animaps, you control duration per animation step, so you can match pacing precisely to your teaching goal. See the education map workflows guide for detailed pacing recommendations.
3. Reduce Cognitive Load
Cognitive load theory tells us that working memory has limited capacity. Every visual element in your animation consumes some of that capacity.
Reduce extraneous load:
- Remove unnecessary labels (show only what students need for this lesson)
- Use a clean map style without distracting terrain textures
- Limit the number of colors (2-3 highlight colors maximum)
- Avoid complex camera movements when the focus should be on the geography
Manage intrinsic load:
- Break complex topics into sequential animations
- Build up complexity gradually (first show the region, then add borders, then add cities)
- Use consistent color coding across a lesson series
Increase germane load:
- Highlight the specific geographic features being discussed
- Use border animations to draw attention to boundaries
- Add labels that match the vocabulary in your lesson
4. Use Consistent Visual Language
Across a lesson, a unit, or an entire course, use the same visual conventions.
Establish and maintain:
- Color meaning: If blue means "allied nations" in one animation, it should mean that in every animation
- Camera behavior: If you always zoom in from the same starting view, students build spatial familiarity
- Label style: Keep font size and placement consistent
- Timing patterns: Use consistent durations so students learn the rhythm
Create a style guide for your course:
| Element | Convention |
|---|---|
| Current country highlight | Gold/amber |
| Historical territory | Light blue |
| Borders | White trace |
| Key cities | Red label |
| Capitals | Red label with icon |
| Routes/paths | Dashed line |
| Contested areas | Striped/hatched |
5. Scaffold From Simple to Complex
Start every geographic topic with the simplest possible animation and build up.
Lesson on World War I alliances:
Animation 1 (simplest): Zoom to Europe. (5 seconds)
- Students see the continent. No details yet.
Animation 2 (add one layer): Highlight the Central Powers in one color. (8 seconds)
- Students identify the core group.
Animation 3 (add another layer): Add the Allied Powers in a second color. (10 seconds)
- Students see the geographic relationship between the two groups.
Animation 4 (add detail): Add labels for capitals and trace the Western Front. (15 seconds)
- Students connect geography to specific battles.
Each animation builds on the previous one. Students never face more new information than they can process.
6. Include Geographic Context
A highlighted country floating in white space teaches nothing about geographic relationships. Always include surrounding context.
Bad: Zoom tight on Japan with no surrounding countries visible. Good: Zoom to East Asia with Japan highlighted, showing its proximity to China, Korea, and Russia.
Bad: Highlight a single African country with no neighbors visible. Good: Highlight the country within its region, showing neighboring nations.
Geographic context is what makes map animations more valuable than simple labeled diagrams. The whole point is to show relationships between places.
7. Leverage the 3D Globe for Scale and Perspective
For topics that involve large distances or global relationships, a 3D globe provides better spatial understanding than a flat map.
Use the globe for:
- Intercontinental trade routes
- Global migration patterns
- Comparing the size of distant countries
- Understanding why flight paths curve (great circle routes)
- Showing how continents relate to each other
Use the flat map for:
- Regional detail (single country or small group)
- City-level geography
- Detailed border studies
- Any topic where the focus area fits comfortably on screen
Animaps automatically renders exports on a 3D Cesium globe, giving students the most accurate spatial representation.
8. Design for Accessibility
Not all students process visual information the same way.
Color accessibility:
- Do not rely on color alone to convey meaning
- Always pair colors with labels or patterns
- Use high-contrast combinations
- Test with colorblind simulation tools
- Avoid red/green as the only distinguishing colors
Pacing accessibility:
- Keep animations slow enough for all students to follow
- Pause between key moments
- Allow replay (provide the animation file, not just a one-time showing)
- Offer written descriptions alongside visual content
Screen accessibility:
- Ensure labels are large enough to read on a projected screen
- Test visibility from the back of the classroom
- Use high contrast between labels and background
- Avoid placing text over busy map areas
9. Align With Curriculum Standards
Map animations are most effective when they directly support specific learning objectives.
Geography (NCSS/C3 Framework):
- Standard: "Use maps and other geographic representations to explain relationships"
- Animation: Show how physical geography (rivers, mountains) influenced settlement patterns
- Create animations that trace travel routes along historical paths
History:
- Standard: "Analyze change and continuity over time"
- Animation: Use border timelapse to show territorial changes over centuries
Social Studies:
- Standard: "Explain how cultural patterns spread across regions"
- Animation: Trace trade routes, migration paths, language spread
Earth Science:
- Standard: "Analyze patterns in natural systems"
- Animation: Show tectonic plate boundaries, ocean currents, climate zones
Pro tip: When planning a unit, list the geographic components of each standard, then create one animation per component. This ensures every animation has a clear curricular purpose.
10. Provide Student Interaction Opportunities
Map animations should not be passive watching experiences.
Before the animation:
- Ask students to predict what they will see
- Have students sketch where they think a border, route, or region is
- Pre-teach key vocabulary (country names, geographic terms)
During the animation:
- Pause at key moments and ask questions
- Have students identify unlabeled locations
- Ask students to describe what geographic relationships they notice
After the animation:
- Students recreate the animation's content on a blank map
- Compare predictions to what they saw
- Discuss why geographic relationships matter to the topic
Student-created animations: With AI tools, students can create their own animations as assessments. Give them a prompt like "Show the route of the Lewis and Clark expedition" and have them use Animaps to build it. This reverses the learning flow — instead of watching and absorbing, students must research and create.
Subject-Specific Tips
Geography Classes
Physical geography:
- Use tilt (camera angle) to show terrain and elevation
- Zoom slowly along mountain ranges, coastlines, and rivers
- Highlight drainage basins, climate zones, and biomes
Human geography:
- Use border animations to show political divisions
- Trace migration routes and trade networks
- Highlight population centers with labeled icons
AI prompt examples:
- "Zoom to the Nile River, trace its path from Lake Victoria to the Mediterranean"
- "Show Africa, highlight the Sahel region, add labels for Chad, Niger, Mali, Burkina Faso"
- "Zoom to Southeast Asia, highlight the Mekong River countries"
History Classes
Ancient history:
- Show the extent of empires with land fill animations
- Trace trade routes (Silk Road, spice routes, trans-Saharan trade)
- Animate the spread of religions, languages, or technologies
Modern history:
- Use border timelapse to show decolonization
- Trace battle fronts and military campaigns
- Show the formation of alliances and international organizations
AI prompt examples:
- "Zoom to the Mediterranean, highlight the Roman Empire at its peak, add labels for Rome, Constantinople, Alexandria, Carthage"
- "Show Europe, trace a path from Normandy to Berlin, add labels for D-Day beaches and Paris"
- "Zoom to Africa, show border changes from 1950 to 1970"
Social Studies
Economics:
- Trace supply chains and trade routes
- Highlight trade bloc members (EU, ASEAN, NAFTA)
- Show resource distribution across regions
Civics:
- Show voting districts and electoral maps
- Highlight capital cities and government centers
- Compare geographic divisions (states, provinces, regions)
Cultural studies:
- Trace language family distributions
- Show the spread of cultural practices
- Highlight UNESCO heritage site locations
Creating Animations for Different Grade Levels
Elementary (K-5)
Keep it simple:
- One location per animation
- Bright, clear colors
- Large labels with simple text
- Short duration (3-8 seconds)
- Zoom in slowly so students can track the movement
Example prompt: "Zoom to Brazil, fill it with green, add 'BRAZIL' label"
Key principle: At this age, the goal is geographic familiarity. Students should learn to recognize continents, countries, and major features.
Middle School (6-8)
Add complexity gradually:
- Multiple related locations (countries in a region)
- Comparisons between places
- Introduction to geographic relationships
- 8-15 second animations
- Begin using border and path animations
Example prompt: "Show Central America, highlight Guatemala, Honduras, El Salvador, Nicaragua, Costa Rica, and Panama, add labels for each capital"
Key principle: Students are building geographic reasoning. Animations should help them understand why places are connected.
High School (9-12)
Support analytical thinking:
- Multi-step animations showing change over time
- Complex geographic relationships
- Data-driven geographic analysis
- 15-30 second animations with multiple scenes
- Use historical border timelapse features
Example prompt: "Start from the world, zoom to the Middle East, highlight OPEC member countries, add labels, then zoom to the Strait of Hormuz and highlight the shipping lane"
Key principle: Students should analyze geographic patterns. Animations are evidence for geographic arguments.
College/University
Research and presentation quality:
- Professional-grade animations for presentations and papers
- Complex multi-location sequences
- Custom styling to match presentation themes
- Export at 1080p/60fps for professional contexts
Technical Tips for Classroom Use
Projection and Display
- Test on your projector before class. Colors look different projected vs. on screen
- Increase label sizes — text that is readable on a laptop may be invisible on a projected screen
- Use dark backgrounds with light labels for projector environments
- Avoid thin lines — they disappear on low-resolution projectors
File Management
- Organize by unit: Create folders for each unit or topic
- Name files descriptively: "unit3-wwi-alliances-central-powers.mp4" not "map1.mp4"
- Keep source prompts: Save the text prompts you used so you can recreate or modify animations later
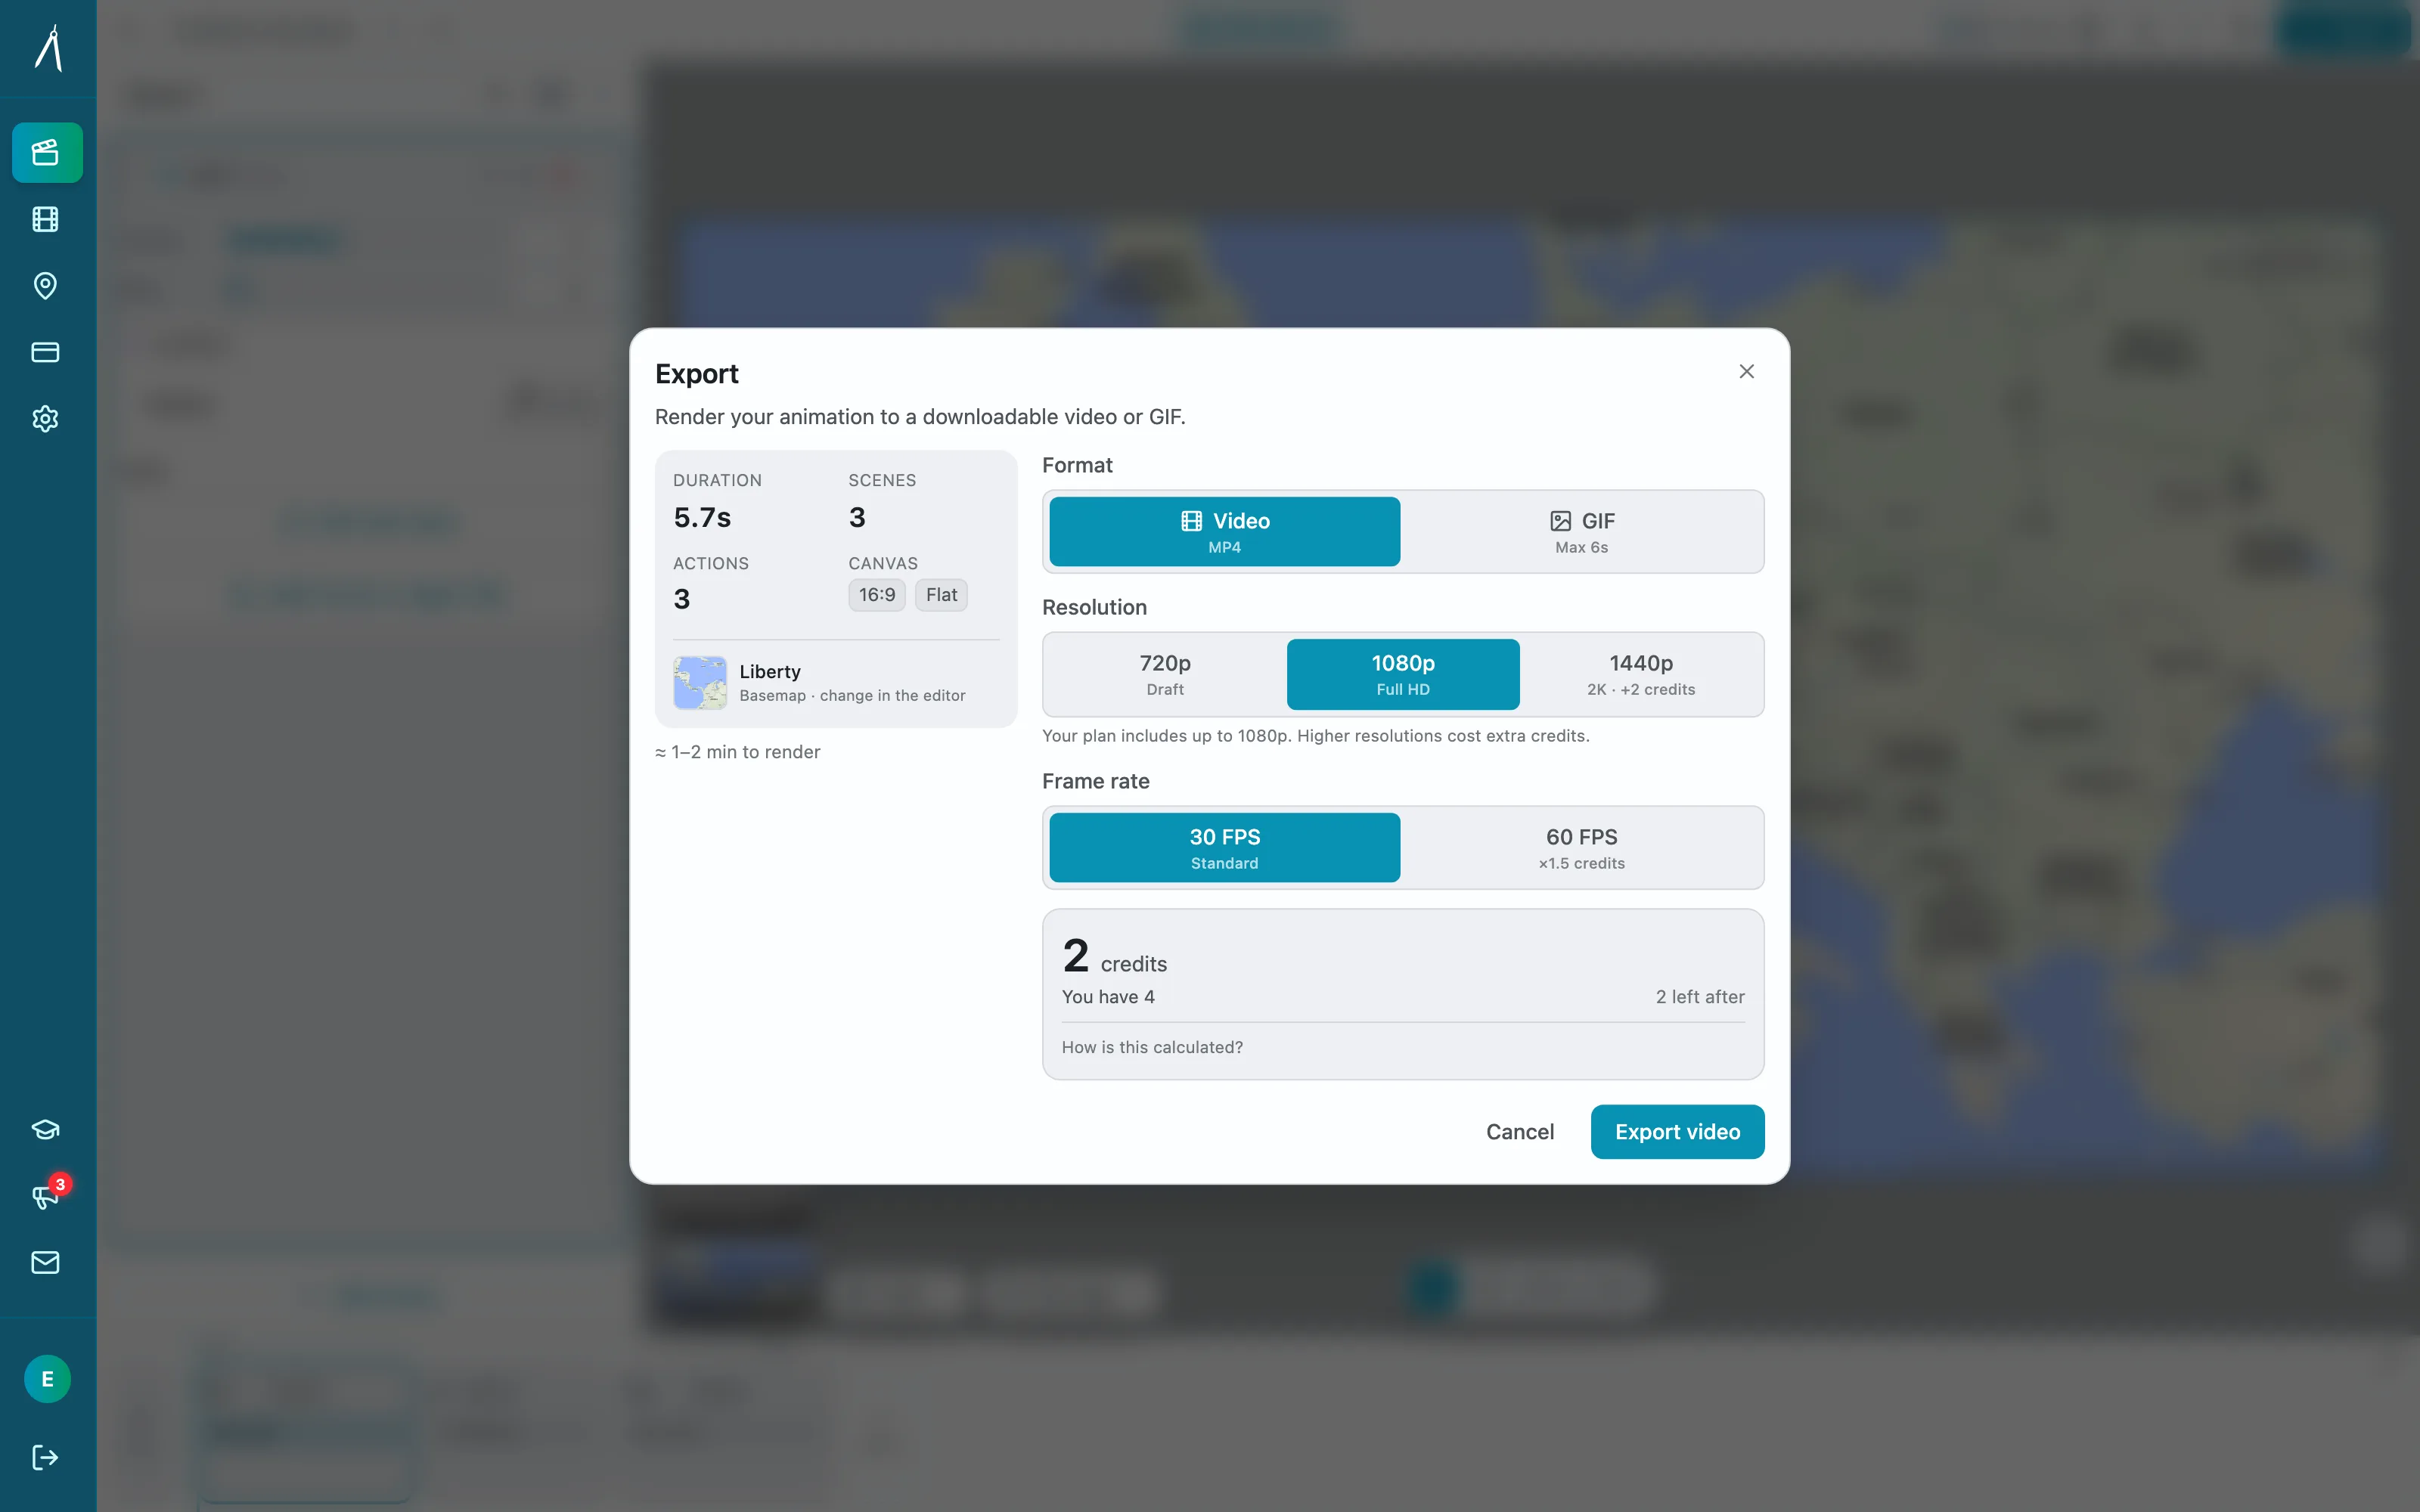
- Export at 1080p even if your projector is 720p — the file will downscale cleanly
Integration with Presentation Tools
Google Slides / PowerPoint:
- Embed MP4 files directly into slides
- Set animations to play on click (not automatically)
- Place related questions or discussion prompts on the following slide
Learning Management Systems (Canvas, Google Classroom):
- Upload MP4 files to assignments or modules
- Include viewing questions alongside the animation
- Allow students to rewatch at their own pace
Interactive Whiteboard (SMART Board, Promethean):
- Play animations full-screen
- Pause and annotate over the paused frame
- Use the freeze frame as a base for discussion
Common Mistakes in Educational Map Animations
Mistake 1: Animation as Decoration
If removing the animation would not change student understanding, the animation is decorative, not educational. Every animation should teach something specific.
Fix: Start with the learning objective, then design the animation to support it.
Mistake 2: Too Fast for Processing
Teachers often create animations at a pace comfortable for them (the expert) rather than for students (the novices).
Fix: Make it slower than you think necessary. Then make it a bit slower still. You can always skip ahead, but students cannot rewind their working memory.
Mistake 3: No Pause for Discussion
Playing an animation straight through without stopping for questions reduces it to background video.
Fix: Break animations into segments. Stop after each segment for questions, predictions, or brief discussions. Alternatively, create separate short animations for each discussion point.
Mistake 4: Inconsistent Across a Unit
Using different colors, styles, and conventions from one lesson to the next forces students to relearn the visual language each time.
Fix: Create a visual style guide for your course and stick to it.
Mistake 5: Replacing the Teacher
Map animations support teaching. They do not replace it. An animation shown without narration, context, or follow-up is just a video.
Fix: Always narrate over animations, provide context before showing them, and follow up with discussion or activities.
Building an Animation Library for Your Course
Step 1: Map Your Curriculum
Go through your curriculum unit by unit. For each unit, identify:
- Key locations students need to know
- Geographic relationships that matter
- Changes over time (border shifts, routes, spread patterns)
- Comparisons between places
Step 2: Create Core Animations
For each unit, create:
- 1 establishing shot (zoom to the region — reusable across lessons)
- 1-3 concept animations (specific to learning objectives)
- 1 assessment-ready animation (complex enough for student analysis)
Step 3: Organize and Label
Create a consistent naming system:
``` [course]-[unit]-[topic]-[sequence].mp4
Examples: world-history-unit4-silk-road-overview.mp4 world-history-unit4-silk-road-cities.mp4 world-history-unit4-silk-road-goods.mp4 ```
Step 4: Iterate Based on Student Response
After using animations in class:
- Did students understand the geographic concepts?
- Were any animations too fast, too slow, or too complex?
- Did students ask questions that suggest a missing animation?
- Could any animation be split into simpler parts?
Adjust your library each semester based on what works.
Cost and Time for Educators
Time Investment
| Task | Traditional Approach | With Animaps |
|---|---|---|
| Create one animation | 30-60 minutes | 60-90 seconds |
| Build a 10-animation unit library | 5-10 hours | 15-20 minutes |
| Build a full-year library (50 animations) | 25-50 hours | 1-2 hours |
Cost
- Animaps Free: 12 credits/month (enough for occasional use)
- Animaps Starter: $99/year or $9.90/month (enough for regular classroom use)
- Animaps Pro: $199/year (enough for building large libraries)
Compare with hiring a designer ($50-150 per animation) or learning After Effects (150+ hours investment).
Getting Started
- Sign up for a free account at animaps.ai (no credit card required)
- Type your first prompt: "Zoom to [your current topic's region]"
- Preview, adjust, and export
- Use in your next class
- Visit the education workflows guide for curriculum-specific templates
The Bottom Line
Effective educational map animations are not about impressive visual effects. They are about clear, well-paced geographic communication that supports specific learning objectives.
The best practices are straightforward:
- One concept per animation
- Pacing matched to the learning goal
- Consistent visual language
- Scaffolded complexity
- Active student engagement
AI-powered tools have removed the technical barrier. Any teacher can now create professional map animations in under two minutes. The remaining challenge — and the one that matters most — is designing animations that genuinely help students learn.
That challenge is a pedagogical one, not a technical one. And teachers are the experts there.
Get started for your classroom:
- Free: 12 credits/month, all features, no credit card
- Start creating: animaps.ai
Related Articles:
Keywords: educational map animations, map animations for teaching, geography animations classroom, history map animations, social studies visual aids, teacher map tools, educational geography tools, animated maps for education, classroom map animations, curriculum map resources
Tags
Related reading
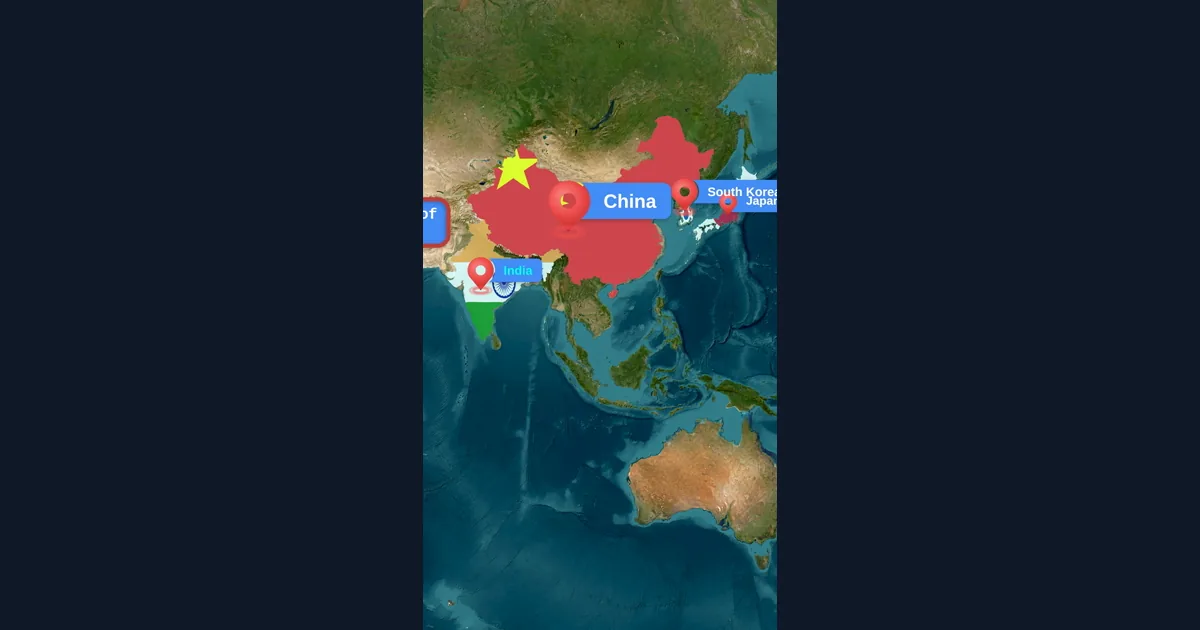
Map Animation Tips for Journalists and News Creators
In today's fast-paced news environment, visual storytelling is more important than ever. Map animations help journalists explain where events are happening, show migration patterns, track conflicts, and make global news more accessible to audiences.
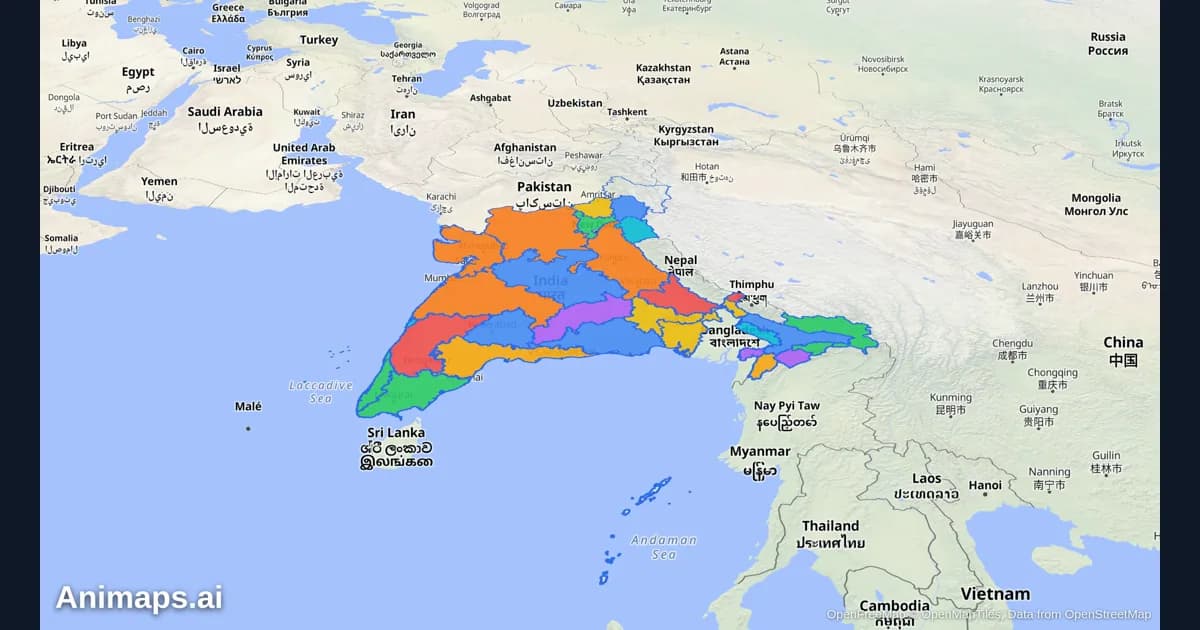
AI-Powered Map Animations vs Traditional Methods: A Complete Comparison
Creating map animations used to require expensive software, hours of manual work, and specialized skills. But AI-powered tools are changing the game. Let's compare the old way with the new way.
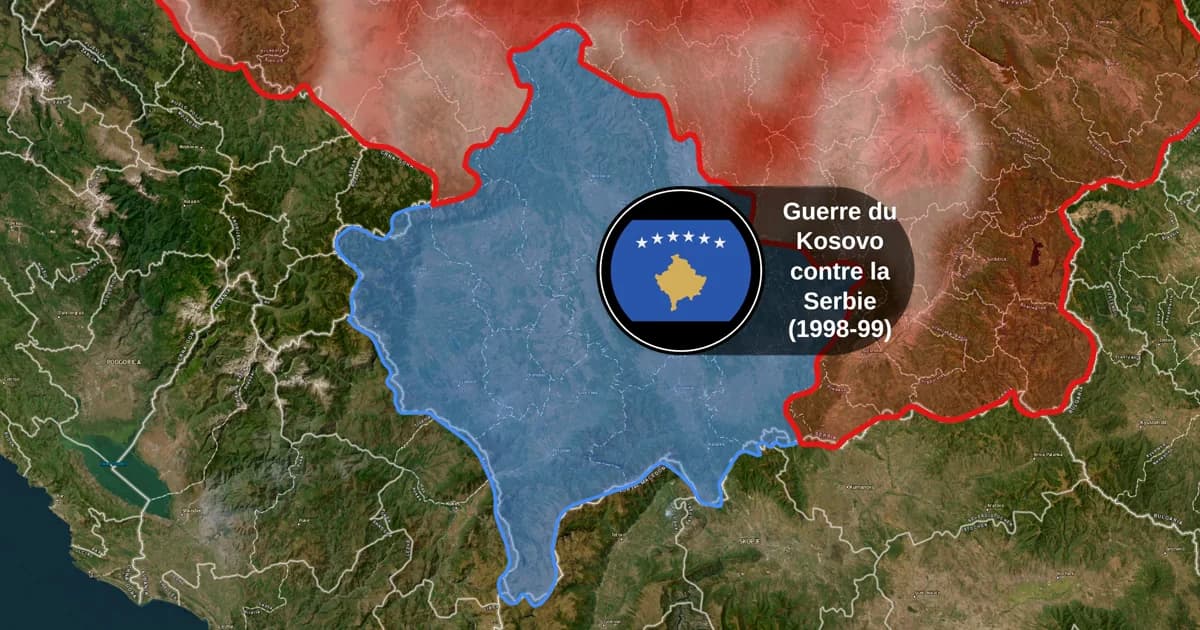
Map Animation Tools: How to Create Animated Maps in 2026
A map animation tool turns a place and a sentence into a moving map video - camera flights, country borders, flag fills, routes, labels - without After Effects, plugins or keyframes. Here is what to look for, and what Animaps does.
Browse every article in the Animaps blog.